Usage
Usage
Usage shows spend and activity for your organization. Partners can filter between Overall (parent + all sub‑orgs) and each individual org; sub‑orgs see only their own Usage.
Partner overview (Overall)
- Remaining Balance, Thresh Amount, and Last Recharge Amount summarize current funding.
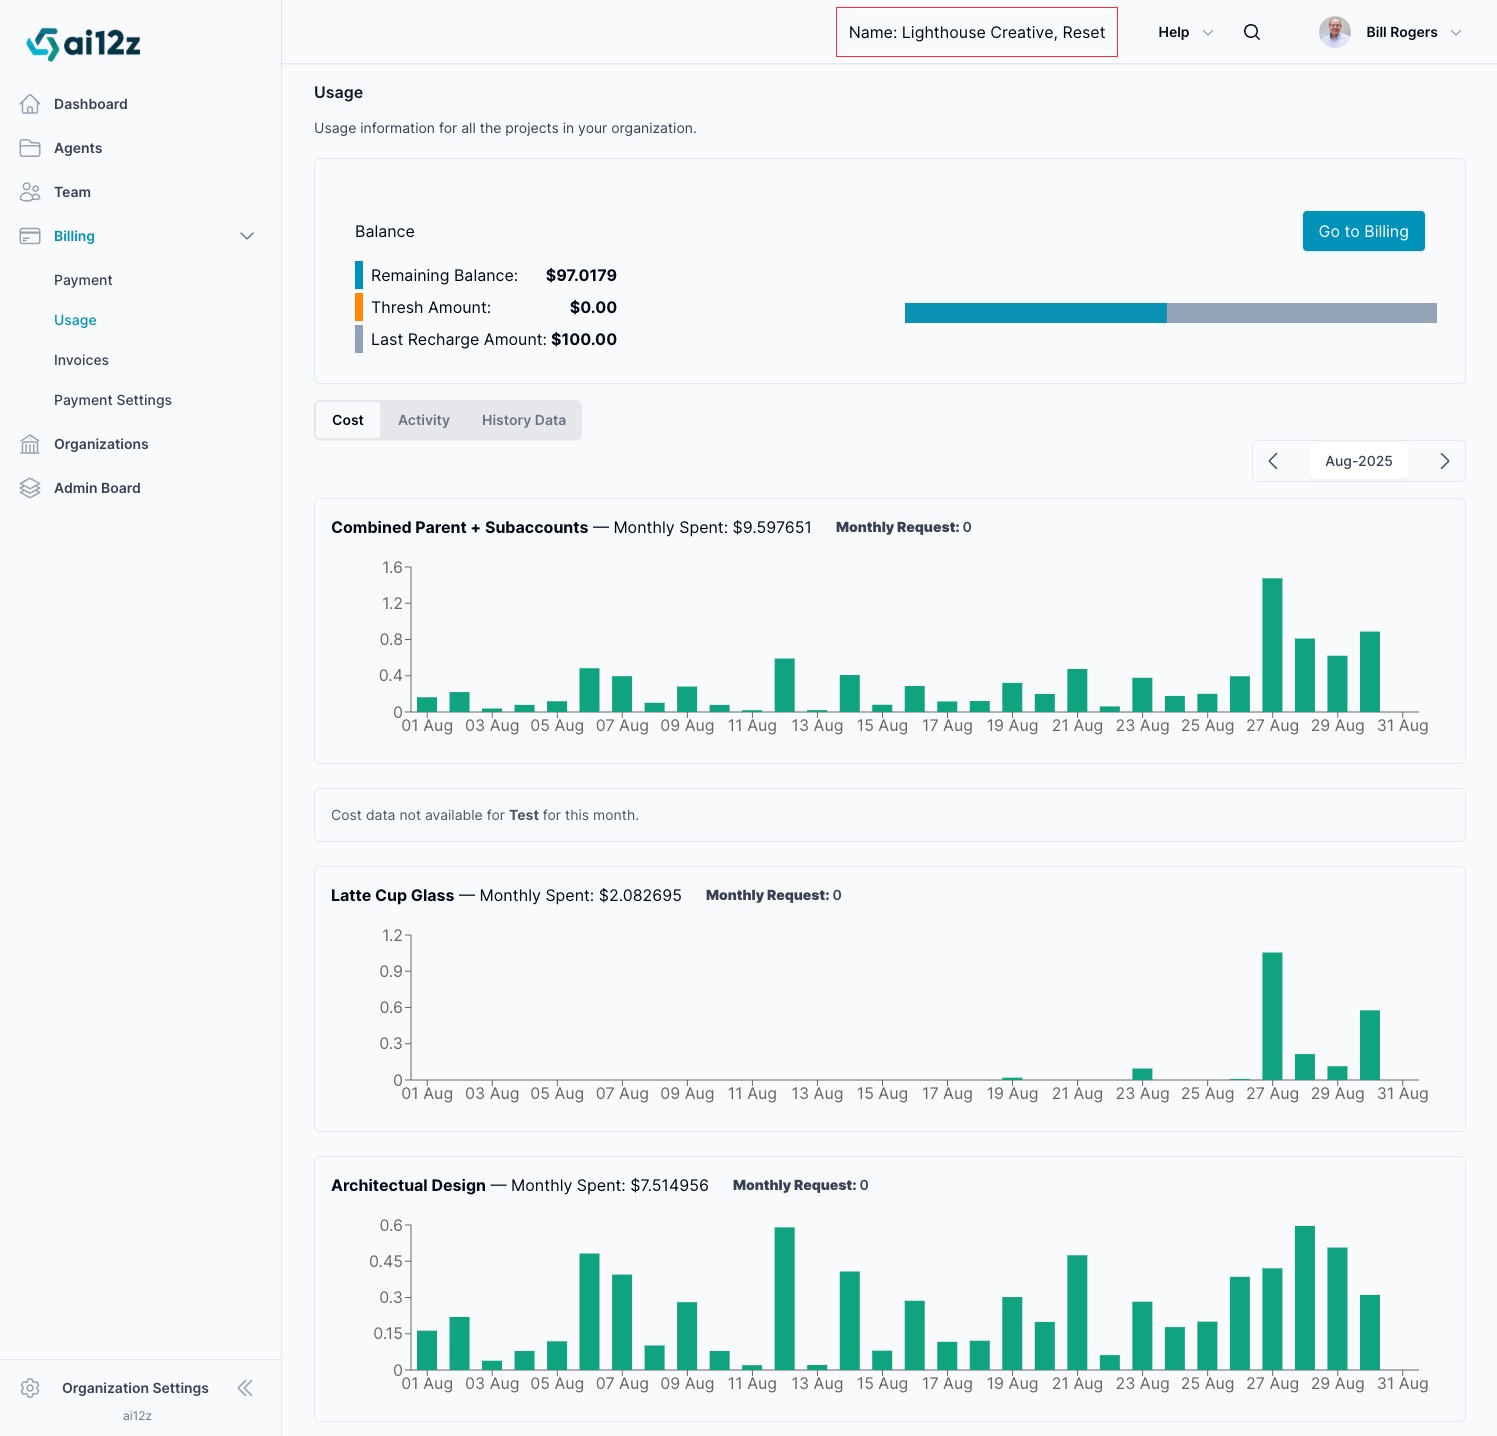
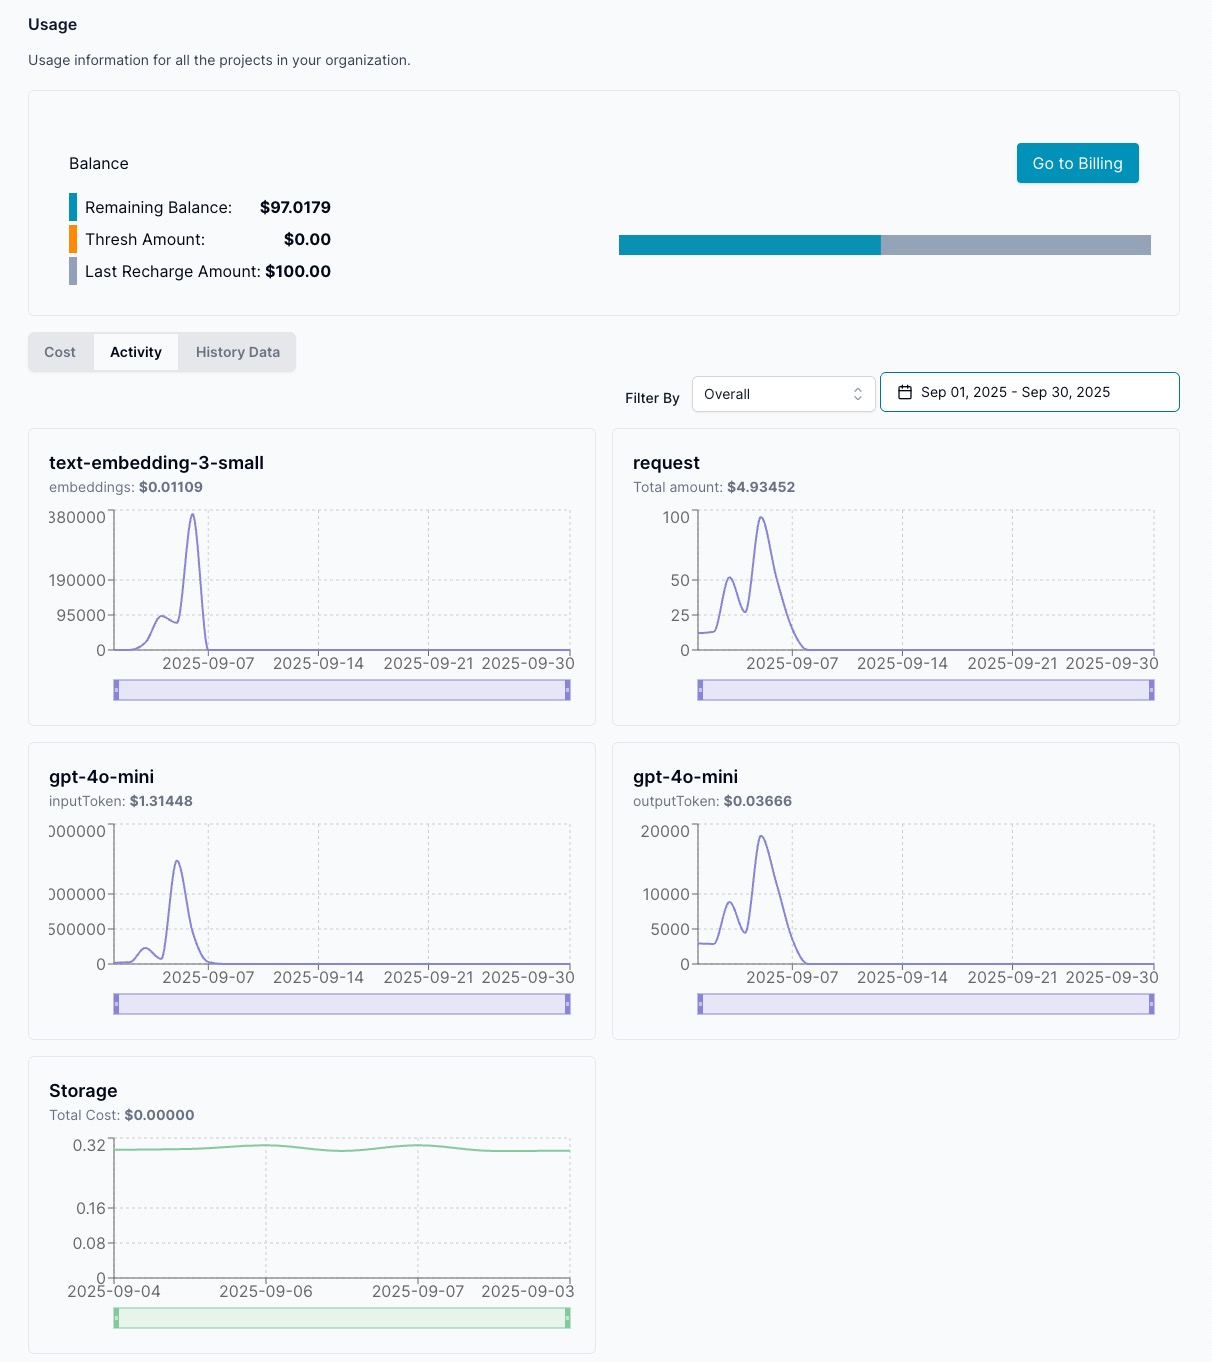
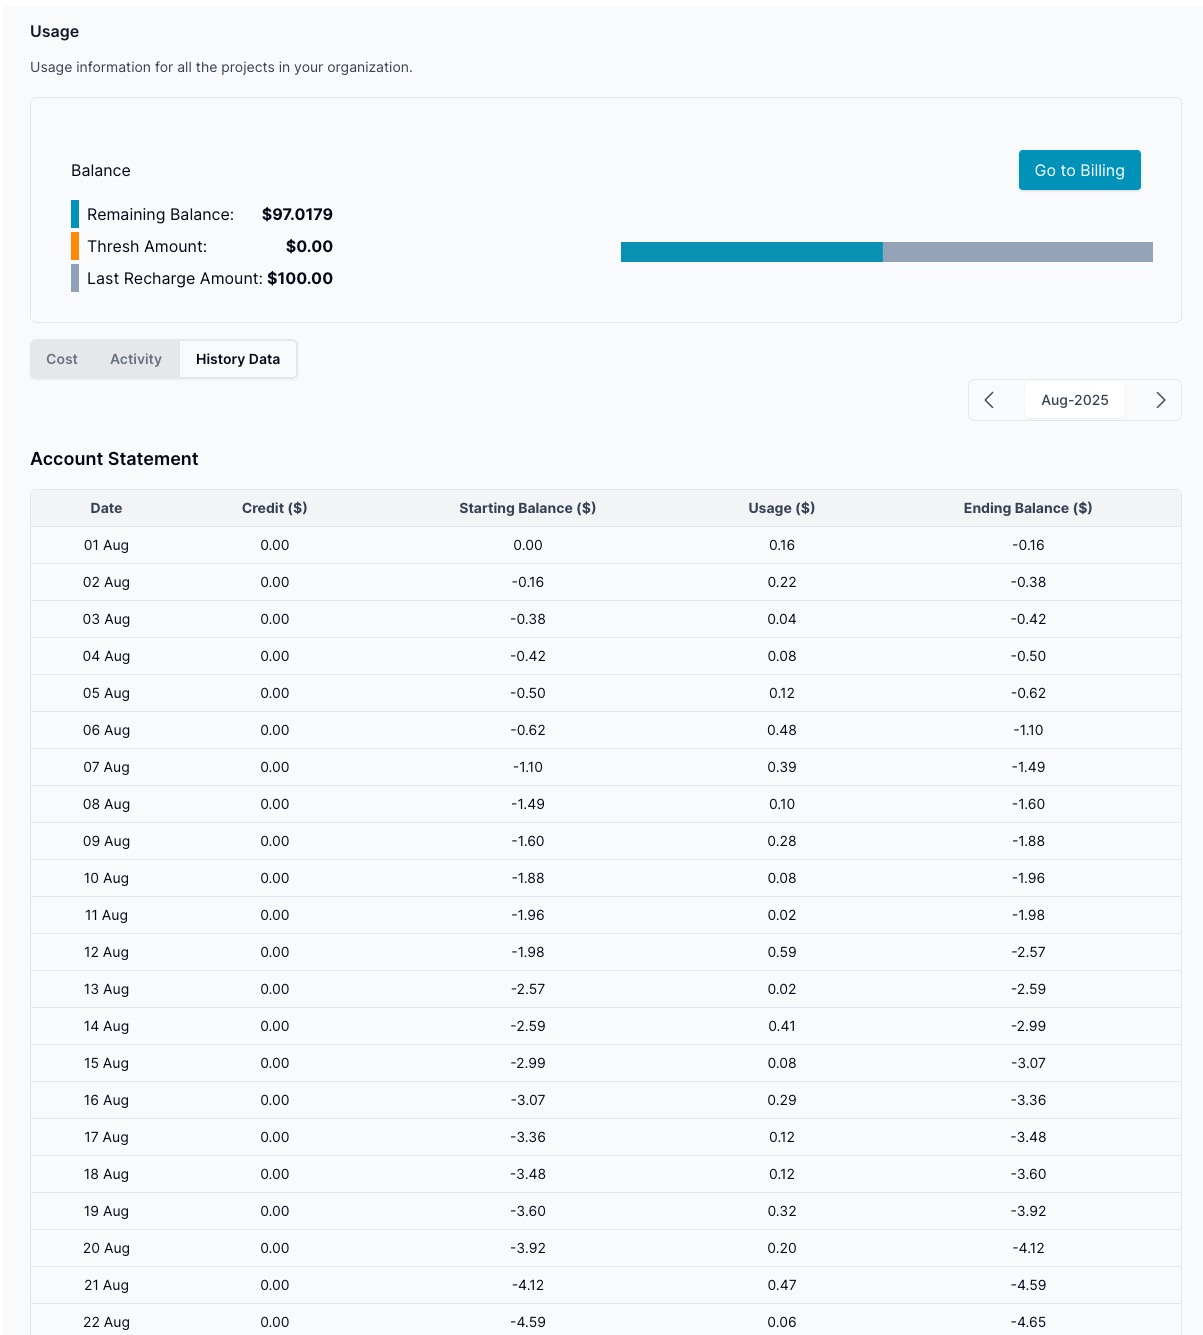
Tabs and charts
- Cost: month‑to‑date cost bars. Use the date picker to change the range.
- Activity: per‑model and request charts. Examples include GPT‑4o‑mini input/output tokens, text‑embedding usage, and request counts.
- History Data: account statement with Starting Balance, Usage, Ending Balance per day.
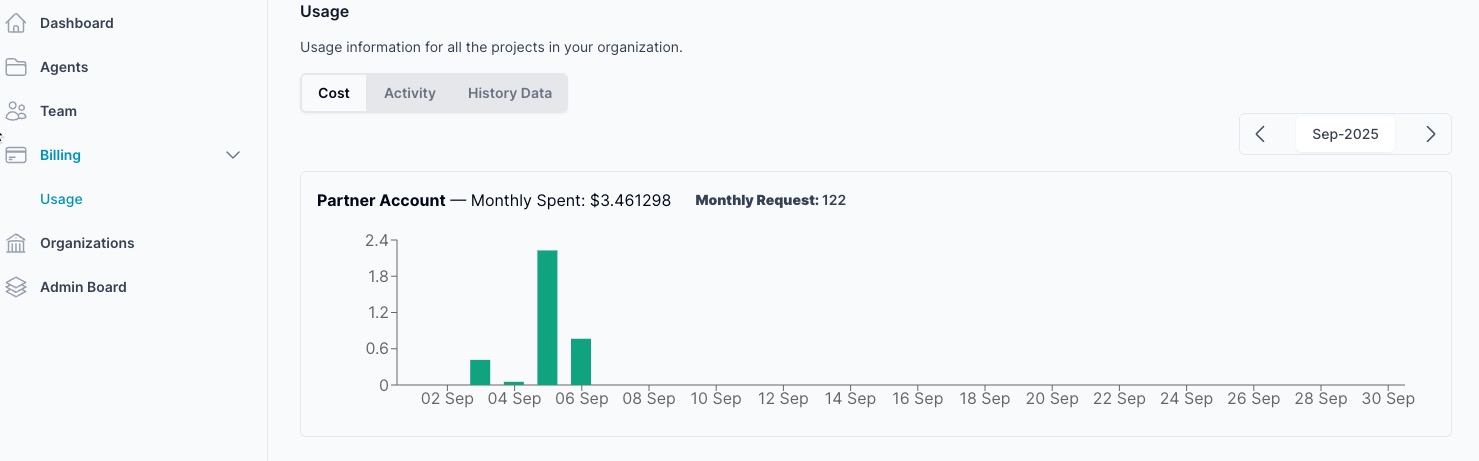
Sub‑organization view
- Sub‑org admins see only the Usage page; Payment, Payment Settings, and Invoices are hidden.
Tips
- Use the org filter to compare spend between sub‑orgs.
- Watch the Activity tab to identify spikes or expensive models.
- Set an auto‑charge threshold in Payment Settings to avoid interruptions.