Analytics
Overview
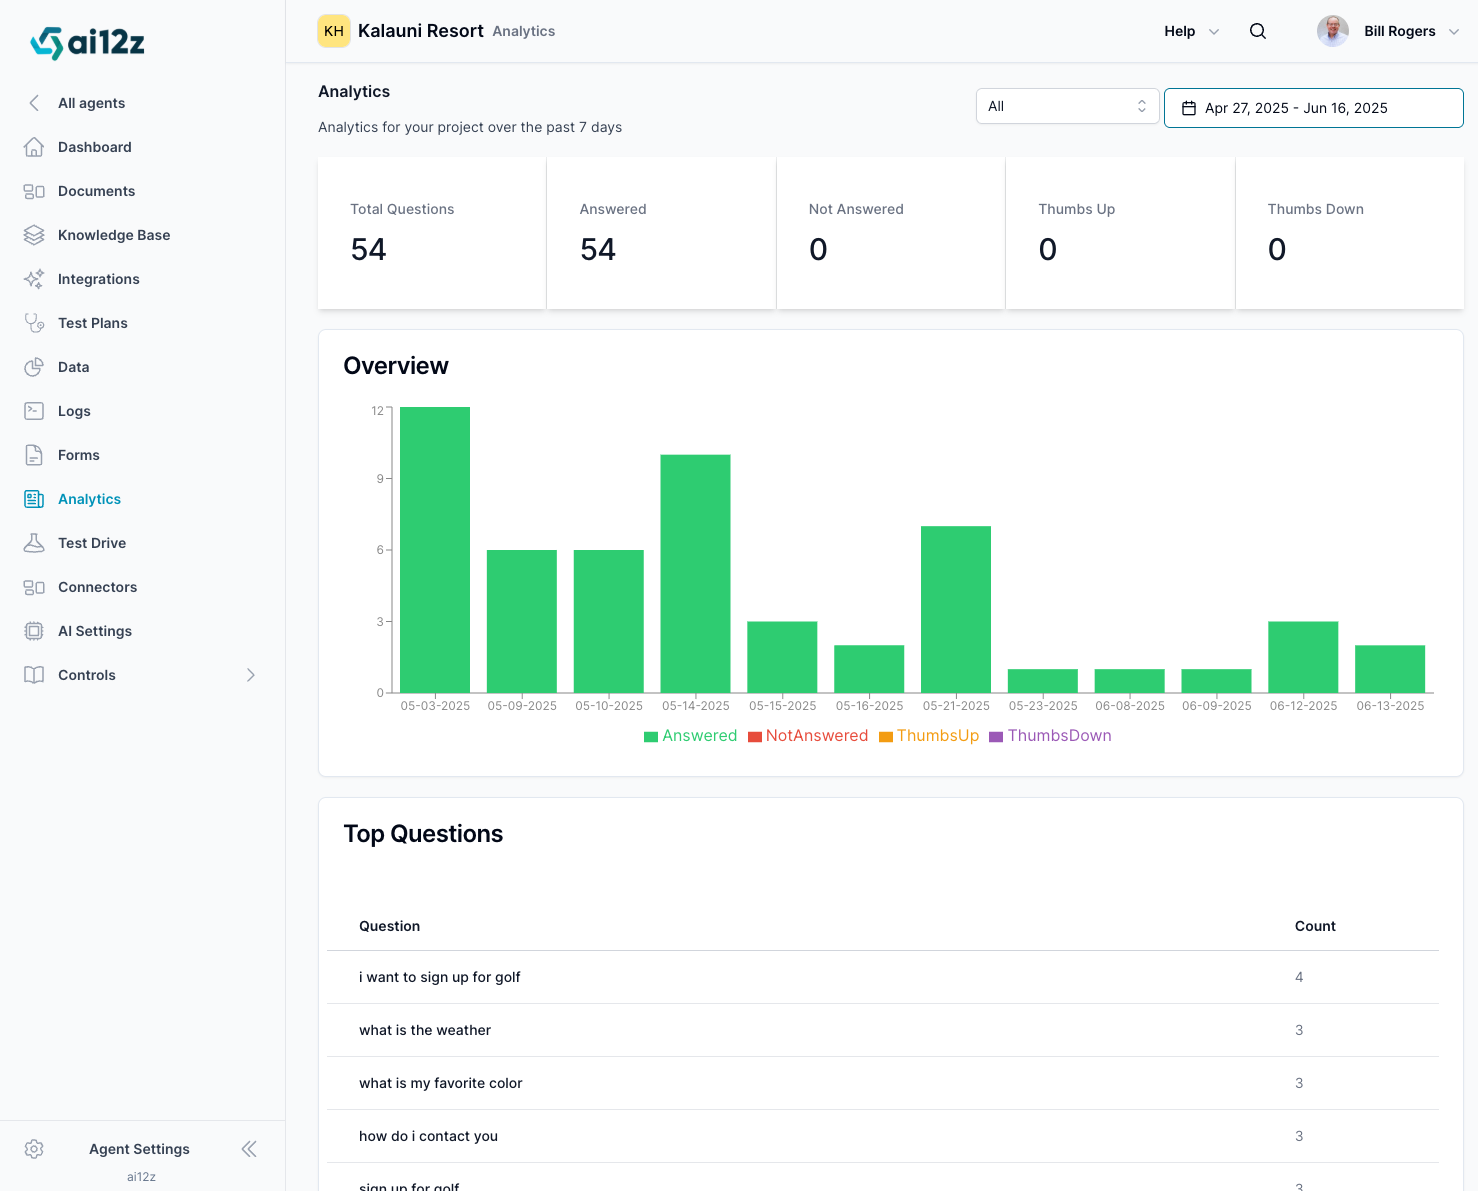
The Analytics dashboard provides a real-time snapshot of your AI Agent’s performance. It helps Agent managers and team members evaluate how effectively the Agent is answering user questions and where improvements may be needed.
Accessing Analytics
To view analytics for your Agent:
- Click Analytics in the left-hand navigation menu.
- The dashboard will display a 7-day summary by default.
- You can use filters to adjust the date range or drill down by API Key, such as
web,mobile, ortest drive.
Key Metrics Explained
Each metric offers valuable insight into your Agent’s performance:
- Total Questions: The total number of questions received by the Agent during the selected timeframe.
- Answered: The number of questions the Agent successfully answered.
- Not Answered: The number of questions that went unanswered, possibly due to knowledge gaps or configuration issues.
- Thumbs Up: The count of positive user feedback ratings on Agent answers.
- Thumbs Down: The count of negative feedback on Agent answers.
Overview Chart
The Overview bar graph shows daily volumes of:
- ✅ Answered
- ❌ Not Answered
- 👍 Thumbs Up
- 👎 Thumbs Down
Utilizing Analytics Effectively
Use analytics to guide improvements and decision-making:
- Measure effectiveness: Compare answered vs. unanswered questions to assess overall coverage.
- Gauge satisfaction: Monitor user feedback to understand where the Agent performs well or needs improvement.
- Identify gaps: Look for recurring unanswered or poorly rated questions and address them in the knowledge base.
- Optimize training: Use insights to refine prompts, documents, and system behavior for better alignment with user needs.
Top Questions
The Top Questions section shows the most frequently asked user queries during the selected timeframe.
This helps you:
- Understand common user interests
- Anticipate future content needs
- Prioritize knowledge base updates
Example:
| Question | Count |
|---|---|
| i want to sign up for golf | 4 |
| what is the weather | 3 |
| what is my favorite color | 3 |
| how do I contact you | 3 |
| sign up for golf | 3 |
Filtering by Source
Analytics can be filtered using API Keys, which are assigned to specific channels like:
- Web (browser-based control)
- Mobile (app integrations)
- Test Drive (internal preview/testing)
This allows you to isolate traffic and performance for each channel and optimize them individually.
By regularly reviewing the Analytics dashboard, you can ensure your Agent is continuously improving and delivering high-quality, helpful interactions for users.