Logs
The Logs section provides comprehensive debug and monitoring information for your AI Agents. This enhanced interface includes advanced filtering, date range selection, export capabilities, and bulk management tools to help you effectively monitor and troubleshoot your agent's operations.
Overview
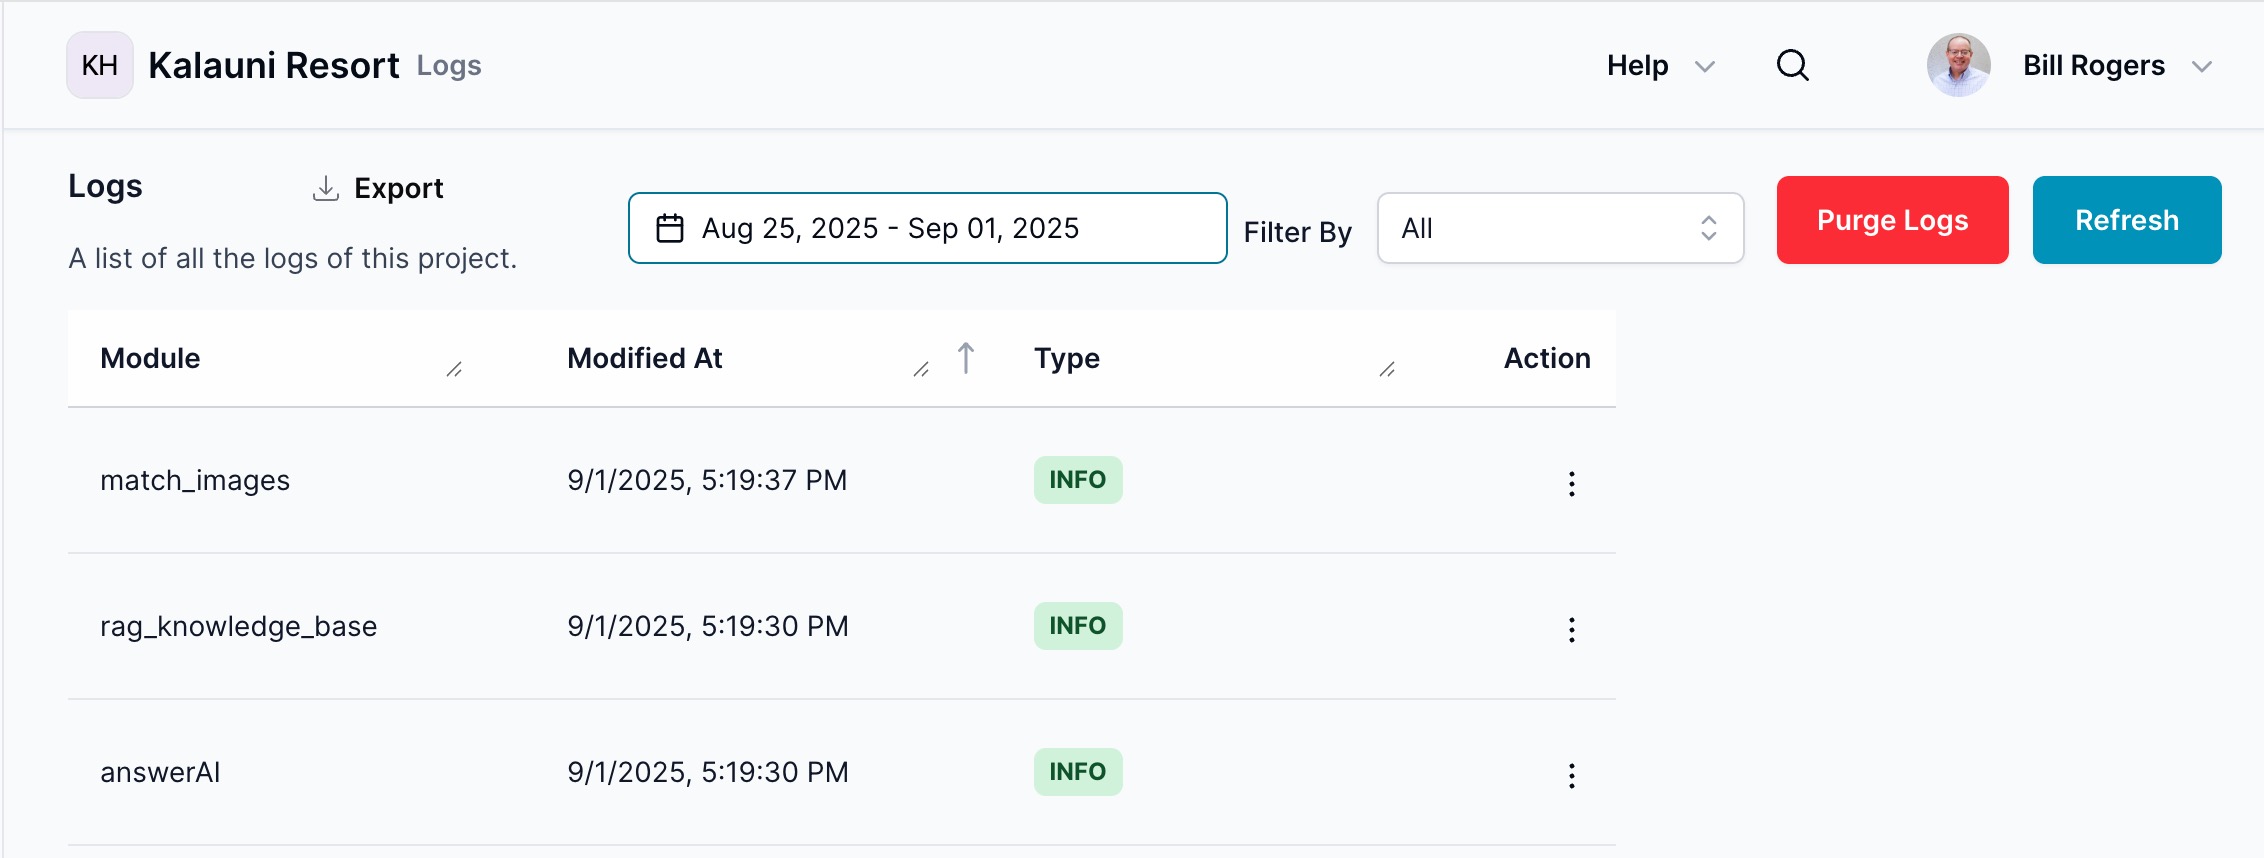
The logs are displayed in a modern table interface with advanced controls and filtering options. The interface includes:
Control Panel�
- Export Button: Download filtered logs for external analysis
- Date Range Picker: Filter logs by specific time periods (e.g., "Aug 25, 2025 - Sep 01, 2025")
- Filter By Dropdown: Apply various filter criteria to focus on specific log types
- Purge Logs: Remove old log entries to manage storage (red button for emphasis)
- Refresh: Update the display with the latest log entries (blue button)
Log Table Columns
- Module: The specific module or component that generated the log entry
- Modified At: Timestamp when the log was created (sortable column)
- Type: Log level indicator with color-coded badges (INFO, ERROR, WARNING, etc.)
- Action: Individual log management options (three-dot menu)
Date Range Filtering
Using the Date Range Picker
- Select Date Range: Click on the date range selector to open the calendar picker
- Choose Dates: Select start and end dates for your desired time period
- Apply Filter: The log table automatically updates to show only entries within the selected range
- Clear Range: Reset to show all available logs
Example Ranges:
- Last 7 days: For recent troubleshooting
- Specific incident periods: To investigate known issues
- Monthly reviews: For regular performance analysis
Export Functionality
Exporting Logs
- Apply Filters: Set date range and any additional filters
- Click Export: Use the export button to download filtered logs
- File Format: Logs are exported in a structured format suitable for analysis
- Use Cases:
- Compliance and audit requirements
- External log analysis tools
- Historical performance tracking
- Incident documentation
Log Management
Purge Logs
The Purge Logs function helps manage log storage:
- Purpose: Remove old log entries to free up storage space
- Caution: This action is typically irreversible
- Best Practice: Export important logs before purging
- Frequency: Regular purging prevents storage issues
⚠️ Warning: Use purge functionality carefully as deleted logs cannot be recovered.
Refresh Logs
- Real-time Updates: Click Refresh to get the latest log entries
- Automatic Refresh: Some log views may auto-refresh periodically
- Status Indication: Button may show loading state during refresh
Advanced Filtering
Filter Options
The Filter By dropdown provides multiple filtering criteria:
- Log Level: Filter by INFO, ERROR, WARNING, DEBUG levels
- Module Type: Focus on specific system components
- Time-based: Combine with date ranges for precise filtering
- Custom Filters: Additional criteria based on log content
Combined Filtering
- Multiple Criteria: Apply date range + filter type simultaneously
- Nested Filtering: Refine results progressively
- Filter Persistence: Maintain filters while navigating
Log Types and Analysis
INFO Logs (Green Badge):
- Informational messages highlighting normal system operations
- Progress indicators and workflow confirmations
- Successful completion of processes
- Examples:
match_images,rag_knowledge_base,answerAI
ERROR Logs (Red Badge):
- Critical issues requiring immediate attention
- System failures and integration problems
- Failed operations and connectivity issues
- Include detailed error messages and troubleshooting information
Interacting with Logs
Viewing Log Details
Each log entry can be expanded for detailed information:
- Click Action Menu: Use the three-dot menu for individual log options
- Delete: Delete a log item
- View: View Details
- View Details: Access comprehensive log information including:
- Precise Timestamp: Exact date and time of the event
- Module Context: Detailed information about the originating component
- Full Message: Complete log message and description
Log Entry Examples
INFO Log Example (match_images):
- Module: match_images
- Modified At: 9/1/2025, 5:19:37 PM
- Type: INFO
- Context: Image processing operation completed successfully
ERROR Log Example (answerAI):
- Module: answerAI
- Modified At: 9/1/2025, 5:19:30 PM
- Type: ERROR
- Details: Failed query processing with stack trace and error codes
Best Practices
Monitoring Workflows
- Regular Review: Check logs periodically for system health
- Error Analysis: Investigate ERROR logs promptly
- Pattern Recognition: Look for recurring issues or trends
- Performance Tracking: Monitor INFO logs for operational insights
Troubleshooting Steps
- Filter by Errors: Start with ERROR log types
- Time-based Analysis: Use date ranges around incident times
- Module Focus: Filter by specific modules showing issues
- Export for Analysis: Download logs for detailed technical review
Maintenance
- Regular Exports: Backup important log data
- Scheduled Purging: Remove old logs to maintain performance
- Filter Management: Use appropriate filters to focus on relevant information
- Documentation: Keep records of significant incidents and resolutions
The enhanced Logs section provides powerful tools for monitoring, troubleshooting, and maintaining your AI Agent's performance and reliability.