Analytics
Overview
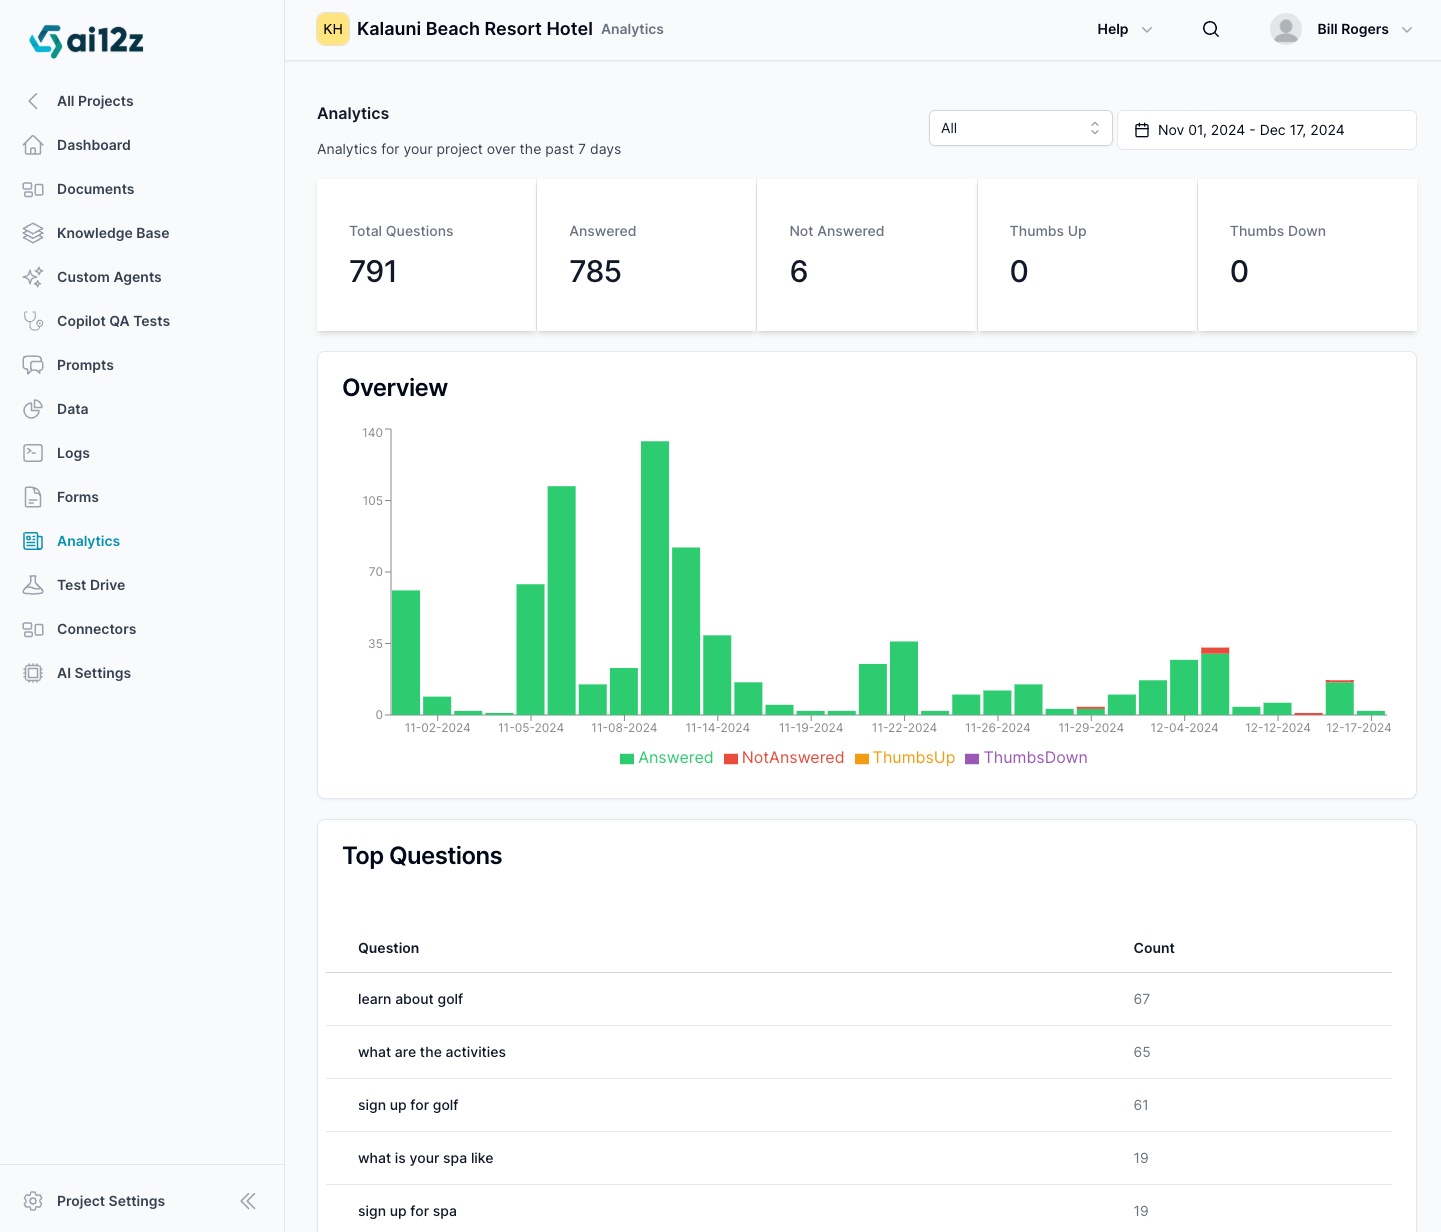
Analytics provide a snapshot of your copilot's interaction with users. This feature allows project managers and team members to monitor the performance and effectiveness of each AI copilot over time.

Accessing Analytics
To view the analytics for your copilot:
- Select 'Analytics' from the left-hand navigation menu within the ai12z platform.
- This view will default to displaying the statistics for the past 7 days.
Understanding Your Analytics
Analytics are broken down into several key metrics:
- Total Questions: The total number of questions asked by users to the copilot.
- Answered: The count of questions that received an answer from the copilot.
- Not Answered: The number of questions that the copilot did not answer.
- Thumbs Up: How often users rated the copilot's answers positively.
- Thumbs Down: The frequency of negative ratings for the copilot's answers.
Utilizing Analytics
The analytics data provides actionable insights:
- Evaluate the effectiveness of the AI copilot by looking at the ratio of answered to not answered questions.
- Assess user satisfaction through the Thumbs Up and Thumbs Down counts.
- Identify areas for improvement by analyzing questions that were not answered or poorly rated.
- Use these insights to refine the AI's knowledge base and response strategies.
Filtering
Filter by date range or key, where the key is applied to the control or API so you know the source of the question i.e. mobile, web, test drive,...
By regularly reviewing your Analytics, you can ensure that the AI copilot is continually evolving and improving to better meet the needs of your users.