Data Reports
Overview
The Data section is a crucial feature that provides insights into how users interact with the AI copilot. It allows project managers to track and analyze questions posed by users and the corresponding answers given, offering an essential resource for refining the copilot's performance and improving user satisfaction.
Accessing the Data Section
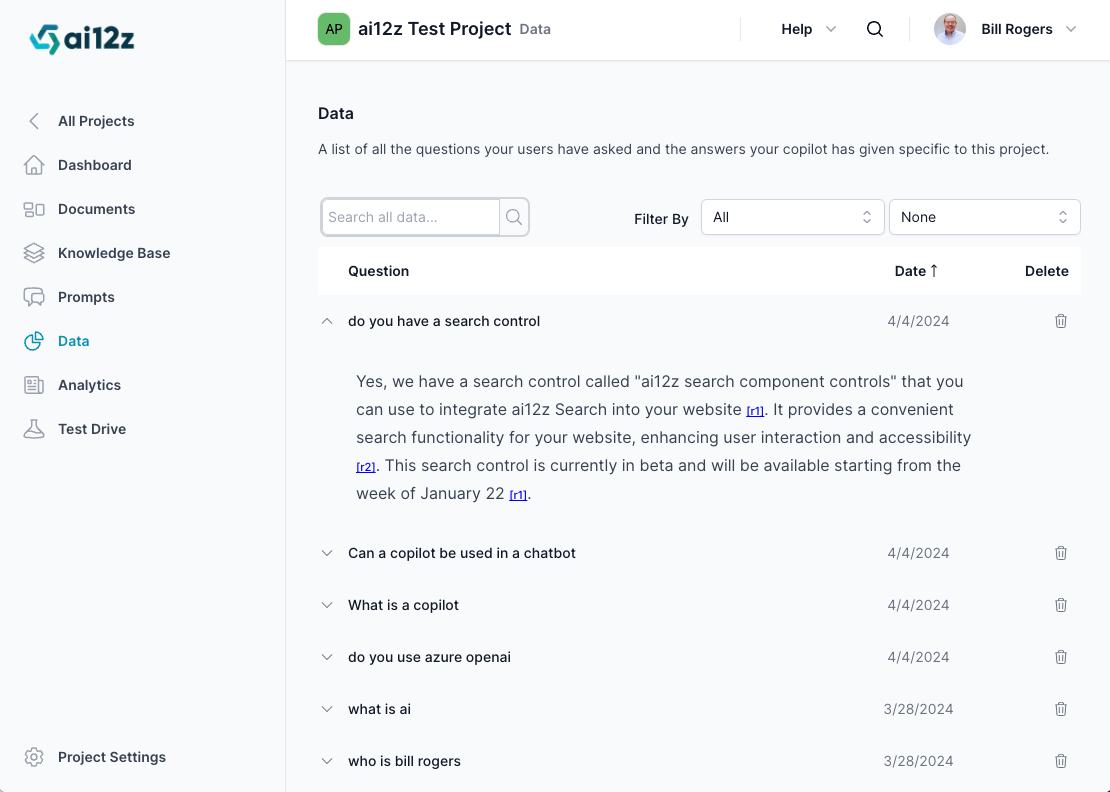
- From the Dashboard, click on the 'Data' tab in the left navigation menu.
- Here, you will see an aggregated list of user questions alongside the answers provided by the AI copilot, if available.
Features and Functionality
Interaction Overview
- The main view lists all user interactions, showing both the questions and the date they were asked.
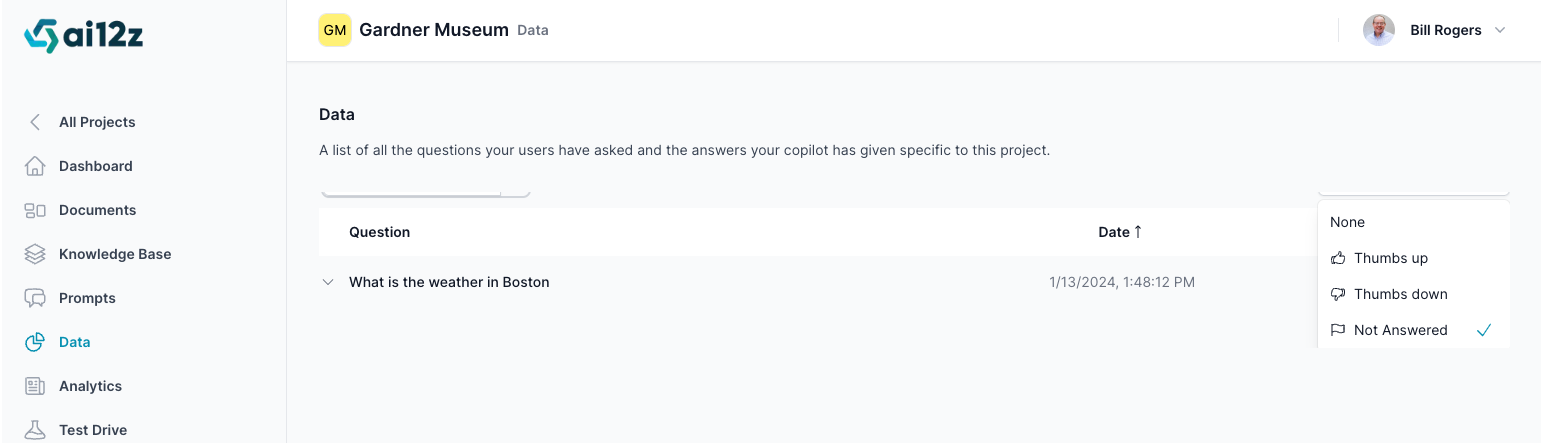
- Each entry indicates whether the AI copilot has provided an answer, with additional options for feedback such as 'Thumbs up', 'Thumbs down', or 'Not Answered'.
Searching and Filtering
- Search Function: Use the search bar to quickly locate specific questions or topics within the data.
- Filter Options: Apply filters to sort the data by feedback received or questions that remain unanswered. Fiter by source, when you create keys you can name them and filter the date from that key. This way you know if the source was a mobile device, a web site, or the test drive
Utilizing User Feedback
The Role of Feedback
- Positive feedback ('Thumbs up') signifies user satisfaction with the AI's response.
- Negative feedback ('Thumbs down') is vital for identifying areas where the AI's performance can be improved.
SEO Implications
- Unanswered questions or those with negative feedback can highlight gaps not only in the AI's knowledge but also in your SEO content strategy.
- Addressing these gaps improves the AI's utility and your website's search engine visibility.
Managing Data for AI Improvement
Content Review and Adjustment
- Regularly examine the questions and AI responses to ensure they are accurate and meet user expectations.
- Update the Knowledge Base and adjust AI prompts based on user feedback and observed trends.
SEO Enhancement
- Analyze user queries to align your website's content with user search intent.
- Incorporate insights into the Knowledge Base to ensure coverage of frequently asked questions and topics.
The Data section is a pivotal asset in the ai12z platform, equipping project managers with the information needed to optimize the AI copilot. By leveraging user interactions and feedback, you can not only boost the AI's performance but also identify strategic opportunities to enhance your online presence through targeted SEO efforts.