GEO Suite Dashboard
Your entire GEO program, one screen, always current.
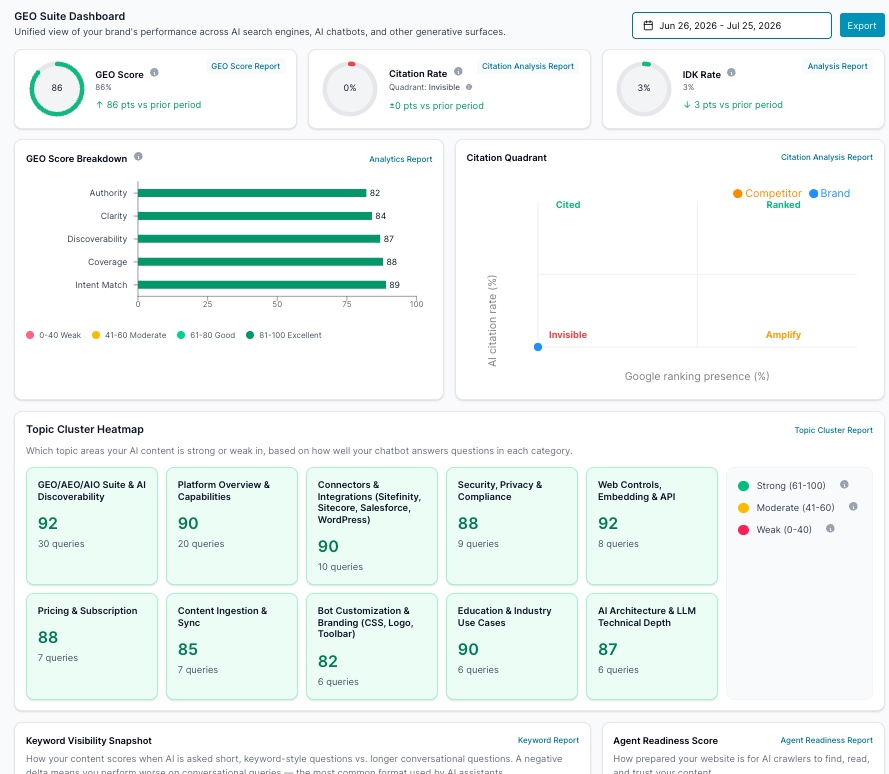
Every other page in the AI Visibility Suite is a report you generate for a specific date range. The GEO Suite Dashboard is different: it's a live, continuously-updated summary that pulls the latest headline signal from every report you've run (Q&A Analysis, Citation Monitor, Keyword Visibility, Agent-Readiness) into a single view, with a shared date range picker, period-over-period deltas on every metric, and a direct link from each panel straight into the full report behind it. It's the first thing to check, and the fastest way to answer "is our GEO program actually moving in the right direction?" without opening five separate PDFs.
What It Does
- Aggregates the headline signal from every other AI Visibility Suite report into one screen: no need to open each report individually for a pulse check
- Applies a single date range picker (e.g. "Jun 26, 2026 – Jul 25, 2026") across the entire dashboard, so every panel reflects the same comparable window
- Shows a period-over-period delta on every metric (e.g. "↑86 pts vs prior period"), automatically compared against the immediately preceding period of equal length
- Three headline KPI rings: GEO Score, Citation Rate, IDK Rate, each linking straight to its source report
- GEO Score Breakdown: the five Q&A Analysis scoring dimensions (Authority, Clarity, Discoverability, Coverage, Intent Match) as a bar chart, color-banded Weak/Moderate/Good/Excellent
- Citation Quadrant: a live mini version of Citation Monitor's diagnostic quadrant, plotting your brand (and tracked competitors) by Google ranking presence vs. AI citation rate
- Topic Cluster Heatmap: every Q&A Analysis topic cluster as a color-coded card (Strong/Moderate/Weak) with its score and query volume, so you can spot a weak cluster without opening the full report
- Keyword Visibility Snapshot and Agent Readiness Score panels: condensed summaries of those two reports
- Export button to pull the current dashboard view out for sharing or reporting
How to Use It
Unlike the rest of the suite, there's no "Generate Report" step: the dashboard is always live against your latest data.
🛠️ Step 1: Navigate to the Dashboard
From the ai12z GEO portal, select GEO Suite Dashboard: it's the first item under AI Discoverability GEO/AEO, above Q&A Analysis.
🛠️ Step 2: Set Your Date Range
Use the date picker in the top-right corner to choose the period you want to review. Every panel on the dashboard (the three KPI rings, the Score Breakdown, the Topic Cluster Heatmap) recalculates against this same window, and every delta shown is that period compared against the immediately preceding period of equal length.
🛠️ Step 3: Drill Into Any Panel
Every panel carries a link in its top-right corner straight through to the full report it's summarizing:
| Panel | Links To |
|---|---|
| GEO Score | GEO Score Report (sourced from Q&A Analysis) |
| Citation Rate | Citation Analysis Report (Citation Monitor) |
| IDK Rate | Analysis Report (Q&A Analysis) |
| GEO Score Breakdown | Analytics Report |
| Citation Quadrant | Citation Analysis Report |
| Topic Cluster Heatmap | Topic Cluster Report |
| Keyword Visibility Snapshot | Keyword Report |
| Agent Readiness Score | Agent Readiness Report |
🛠️ Step 4: Export
Click Export to download the current dashboard view for a leadership update or a status report.
What Each Panel Means
GEO Score
Your overall GEO Score as a ring, with the period-over-period delta directly beneath it (e.g. "↑86 pts vs prior period"). This is the same headline score Q&A Analysis computes: the ring just gives you the current number and its trend at a glance, without opening the PDF.
Citation Rate
The share of your tracked queries where at least one LLM cited your brand, plus which quadrant that rate currently falls in (e.g. "Quadrant: Invisible"). This is sourced from Citation Monitor: a 0% rate sitting in the Invisible quadrant is a clear, at-a-glance signal that citation work is the priority, before you ever open the full report.
IDK Rate
The percentage of questions your chatbot answered with "I don't know," with its delta vs. the prior period. Unlike the other two rings, a falling IDK Rate is the good direction: the dashboard shows this as a downward arrow (e.g. "↓ 3 pts vs prior period").
GEO Score Breakdown
A bar chart of the same five dimensions Q&A Analysis scores: Authority, Clarity, Discoverability, Coverage, Intent Match, color-banded into four tiers:
| Band | Range |
|---|---|
| Weak | 0–40 |
| Moderate | 41–60 |
| Good | 61–80 |
| Excellent | 81–100 |
This lets you spot which single dimension is dragging down your overall GEO Score without reading the full Q&A Analysis report.
Citation Quadrant
A live, mini version of the diagnostic quadrant from Citation Monitor: Google ranking presence (%) on the X-axis, AI citation rate (%) on the Y-axis, split into four quadrants: Invisible, Cited, Ranked, and Amplify. Your brand's dot and any tracked competitors' dots are plotted directly on the chart, so a brand sitting at the origin (0% citation, low ranking presence) is immediately visible as sitting in the Invisible quadrant: the same diagnosis Citation Monitor gives in full, just visualized instantly on load.
Topic Cluster Heatmap
Every topic cluster from your latest Q&A Analysis, shown as a card with its score and query volume, color-coded:
| Band | Range |
|---|---|
| Strong | 61–100 |
| Moderate | 41–60 |
| Weak | 0–40 |
Cards are sorted by volume, so the topics your customers ask about most are the first ones you see: with their query count right on the card (e.g. "GEO/AEO/AIO Suite & AI Discoverability: 92, 30 queries"). A cluster that drops into the Weak band here is your cue to open the full Q&A Analysis report and check its recommended action.
Keyword Visibility Snapshot
A condensed summary of how your content scores when AI is asked short, keyword-style questions vs. longer, conversational ones. A negative delta here means you perform worse on conversational queries, the format most AI assistants actually use, which is the same format-delta diagnosis Keyword Visibility reports in full.
Agent Readiness Score
A condensed summary of how prepared your site is for AI crawlers to find, read, and trust your content, sourced from the Agent-Readiness Audit.
Key Outputs
- Three headline KPI rings: GEO Score, Citation Rate, IDK Rate, each with a period-over-period delta and a link to its source report
- GEO Score Breakdown: bar chart of the five scoring dimensions, color-banded Weak/Moderate/Good/Excellent
- Citation Quadrant: live scatter plot of brand vs. competitors by ranking presence and citation rate
- Topic Cluster Heatmap: every topic cluster as a color-coded, volume-sorted card
- Keyword Visibility Snapshot and Agent Readiness Score condensed panels
- Shared date range picker applied across every panel, with automatic prior-period comparison
- Export: download the current view
Perfect For
- Anyone who wants a single pulse-check screen instead of opening five separate reports
- Leadership and stakeholders who want the headline number and trend, not the full detail
- Teams running the AI Visibility Suite as an ongoing program and checking in weekly or monthly
- Quickly spotting which single report deserves a closer look this week
Related Documentation
- Q&A Analysis: Source of the GEO Score, IDK Rate, GEO Score Breakdown, and Topic Cluster Heatmap
- Citation Monitor: Source of the Citation Rate and Citation Quadrant
- Keyword Visibility: Source of the Keyword Visibility Snapshot
- Agent-Readiness Audit: Source of the Agent Readiness Score panel
- Q&A Insights: The live, per-conversation view of the same chatbot conversations Q&A Analysis clusters into the Topic Cluster Heatmap
- Web Content Quality: The live, per-page quality score behind your ingested content, at a level of detail this dashboard doesn't show
- AI Visibility Suite Overview: How the dashboard fits alongside the rest of the AI Visibility Suite
- The Low-Friction Go-to-Market Playbook: What a mature account running this loop looks like, and how to get a new prospect here