GEO Trend Comparison
Track your GEO trajectory period-over-period.
GEO Trend Comparison takes two completed Q&A Analysis reports and computes the diff between them: a single trajectory score, four key metric deltas, which question themes grew or disappeared, how competitive pressure shifted, and a short list of prioritized actions for the next cycle. It's the report that turns a single Q&A Analysis snapshot into something you can report on, proof that your GEO program is (or isn't) working.
What It Does
- Computes a structured diff between two report periods: GEO score delta, question volume change, IDK rate change, and competitive intent rate change
- Assigns a Trend Score (0–100) and an overall verdict:
improving,stable,declining, ormixed - Writes a narrative Executive Summary that connects the metric moves into a single story (e.g., "IDK rate collapsed while competitive intent surged")
- Surfaces Key Insights: the specific patterns behind each metric change, backed by real numbers pulled from both reports
- Splits findings into Top Wins and Top Concerns: what to protect vs. what to fix before the next reporting period
- Tracks Theme Shifts: every question cluster's share of volume in each period, so you can see exactly which topics are growing, shrinking, newly appearing, or have dropped out entirely, with competitive clusters flagged inline
- Reports Competitive Intent movement: the rate itself, plus which competitor names are newly mentioned and which have disappeared since the last period
- Produces 3 prioritized, numbered Recommended Actions to sustain wins, close gaps, and reverse declines before the next period
- Generates a full PDF with metric cards, the theme shift table, and the narrative
No new conversations required: works entirely from two existing Q&A Analysis reports, so there's no incremental data-collection cost, only the cost of the narrative synthesis.
How to Generate a Report
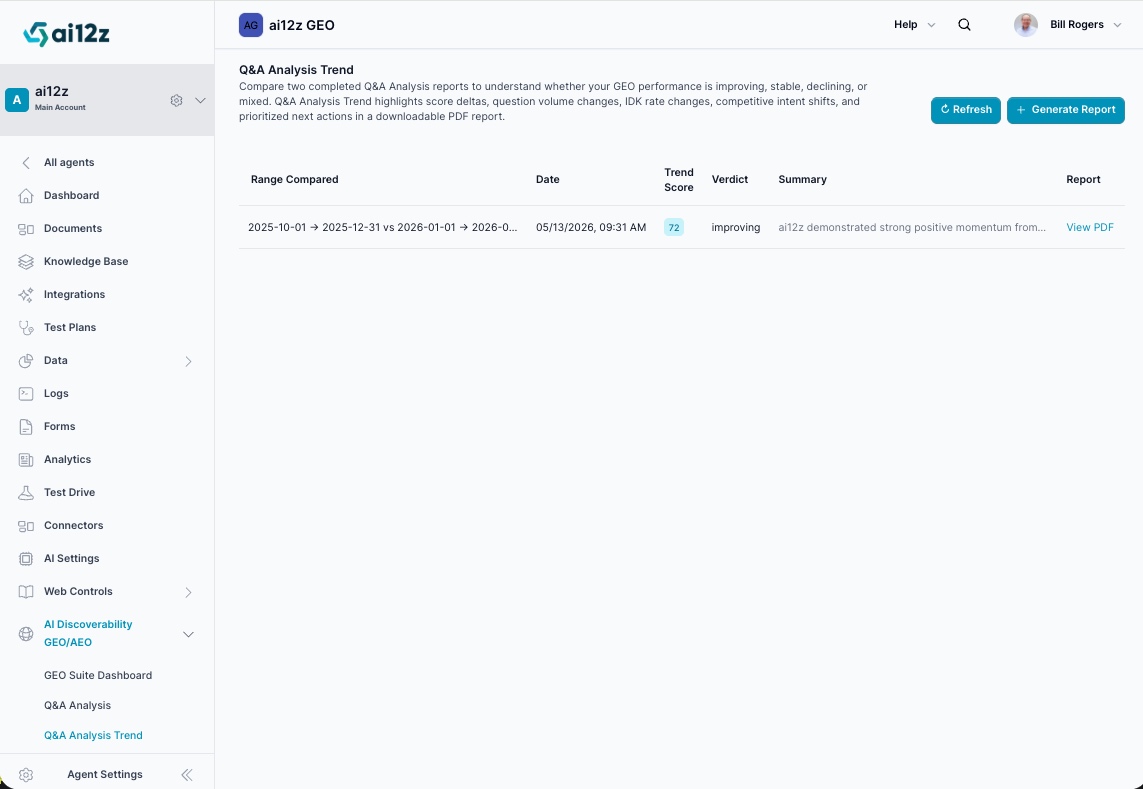
🛠️ Step 1: Navigate to Q&A Analysis Trend
From the ai12z GEO portal, select Q&A Analysis Trend from the navigation menu (nested directly under Q&A Analysis).
🛠️ Step 2: Click + Generate Report
Click the + Generate Report button in the top-right corner.
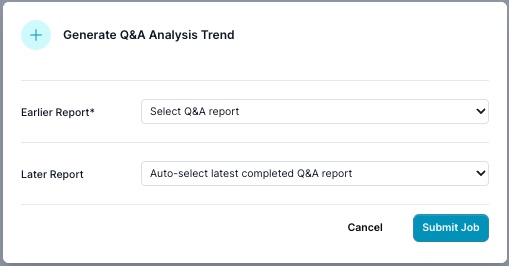
🛠️ Step 3: Select Your Reports
| Field | Description |
|---|---|
| Earlier Report* | Required. The Q&A Analysis report from the first (earlier) period |
| Later Report | Optional. The Q&A Analysis report from the second (later) period; leave blank and it auto-selects the most recently completed Q&A Analysis report |
You must have run Q&A Analysis at least twice before using this report. Trend Comparison only ever diffs two existing reports: it never re-reads your raw conversations, so pick two reports whose date ranges don't overlap if you want a clean read on what changed.
🛠️ Step 4: Submit and Wait
Click Submit Job. The comparison runs asynchronously. Click Refresh to check for completion.
🛠️ Step 5: View Your Report
Once complete, click View PDF to download the trend report.
What's Inside the PDF
| Section | Covers |
|---|---|
| Cover / Trajectory Score | Both period ranges being compared, the overall verdict badge (Improving / Stable / Declining / Mixed), and the Trend Score out of 100 |
| Executive Summary | A short narrative connecting every metric move into one story: what happened, and why it matters |
| Key Metrics | Four side-by-side cards: GEO Score, Question Volume, IDK Rate, and Competitive Rate, each showing period 1 → period 2 and the delta |
| Key Insights | The specific patterns behind the metric changes, with the real numbers driving each one |
| Top Wins | What improved meaningfully and should be protected or amplified next cycle |
| Top Concerns | What declined or needs attention before the next reporting period |
| Theme Shifts | Every question theme's share of total volume in each period, sorted to surface new themes, growing themes, and themes that disappeared |
| Competitive Intent | The competitive question rate move, plus exactly which competitor names are newly mentioned and which are no longer mentioned |
| Recommended Actions | 3 prioritized, numbered actions for the next reporting period, each with a one-line rationale |
Interpreting the Metrics
The four Key Metrics cards all render the same way: period 1 → period 2 followed by a delta glyph and a signed number. What counts as "good" depends on the metric, not the arrow:
| Metric | What It Measures | A Healthy Move |
|---|---|---|
| GEO Score | Aggregate content quality / AI-readiness score carried over from Q&A Analysis | Rising |
| Question Volume | Total questions asked across the period | Rising; usually reflects growing discovery and reach, but read it alongside IDK Rate: a volume spike paired with a rising IDK Rate can mean a new, unaddressed topic is driving traffic |
| IDK Rate | Share of questions your bot answered with "I don't know" | Falling |
| Competitive Rate | Share of questions that name or compare you to a competitor | Context-dependent: rising isn't automatically bad. It usually means more prospects are actively evaluating you, which is a signal to prioritize comparison content, not a problem to suppress |
The delta glyph on each card indicates the card moved, not whether the move was favorable: read the signed number and the Executive Summary/Key Insights narrative together. In the example above, IDK Rate improved by falling 10.8 points while Competitive Rate rose 4.3 points in the same period; both showed up as positive-direction cards, but only one of them is flagged as a Top Concern.
Key Outputs
- Trend Score (0–100): Overall trajectory health; 50 = neutral, above 50 = positive momentum
- Overall Verdict:
improving/stable/declining/mixed - Executive Summary: A short narrative synthesizing every metric move into a single story
- GEO Score Delta: Before vs. after with direction
- Question Volume Delta: Are more customers asking questions, and is that growth healthy or gap-driven?
- IDK Rate Delta: Is your bot getting better at answering?
- Competitive Intent Delta: Are competitive comparisons increasing, and against whom?
- Key Insights: The specific, numbers-backed patterns behind each metric change
- Top Wins: What improved and should be protected or amplified
- Top Concerns: What declined and needs attention before the next period
- Theme Shifts: New topics, dropped topics, growing clusters, shrinking clusters, with competitive clusters flagged inline
- Competitor Changes: Which competitor names appeared or disappeared this period
- Recommended Actions: 3 prioritized, numbered actions for the next reporting cycle
- PDF Report: Full trend report, downloadable and shareable
Understanding the Report Table
The report list shows every trend comparison you've generated; like the Q&A Analysis list it's built from, it's never pruned automatically.
| Column | Description |
|---|---|
| Range Compared | Both date ranges being diffed, shown as period 1 vs period 2 |
| Date | When the comparison was generated |
| Trend Score | Overall trajectory health (0–100) |
| Verdict | improving / stable / declining / mixed |
| Summary | The opening line of the Executive Summary |
| Report | Link to download the PDF |
Perfect For
- Monthly or quarterly performance reviews
- Proving ROI of content investments ("questions in this cluster dropped 40% after we published the FAQ")
- Catching emerging trends, and emerging competitors, before they become large gaps
- Tracking competitive pressure over time without re-reading every Q&A Analysis PDF by hand
- Giving leadership one number (the Trend Score) and one verdict instead of two disconnected reports
Example Report Walkthrough
A real comparison between 2025-10-01 → 2025-12-31 and 2026-01-01 → 2026-05-12 produced a Trend Score of 72/100 and a verdict of Improving:
| Metric | Period 1 | Period 2 | Change |
|---|---|---|---|
| GEO Score | 76.0 | 78.0 | +2.0 |
| Question Volume | 417 | 667 | +250 (+60%) |
| IDK Rate | 12.6% | 1.8% | −10.8pp |
| Competitive Rate | 1.0% | 5.3% | +4.3pp |
Key Insights called out that the IDK rate collapse meant the knowledge base now answered 98.2% of incoming queries, that the 60% volume surge suggested growing discovery in generative engine results, and that competitive intent surged alongside 13 new competitor mentions (including Drift and generic "traditional search" alternatives), meaning users were actively evaluating ai12z against other options.
Top Wins included the IDK rate drop, the volume growth, the GEO Score gain, and 25 newly emerged themes (Case Studies, Industry & Market Fit, Setup & Implementation, Salesforce & Enable). Top Concerns flagged the competitive pressure increase and 31 dropped themes (including Analytics & Reporting and Customization & Branding) as possible signs of content staleness.
The Theme Shifts table lists every cluster's share of volume in each period, with clusters the underlying Q&A Analysis tagged as competitive called out inline:
| Theme | Period 1 | Period 2 | Change |
|---|---|---|---|
| Case & Studies | 0.0% | 0.3% | ▲ new |
| Salesforce & Enable | 0.0% | 0.5% | ▲ new |
Competitors & Comparisons competitive | 0.0% | 0.3% | ▲ new |
| Analytics & Reporting | 1.2% | 0.0% | ▼ dropped |
| Customization & Branding | 1.0% | 0.0% | ▼ dropped |
The Competitive Intent section confirmed the rate move (1.0% → 5.3%) and listed the newly mentioned names (Drift, Drift Chatbot, Traditional Search, Traditional Contact, Traditional Live, among others) against the two phrases that dropped out (Just Rag, Standard Rag).
That combination of signals drove three Recommended Actions: build competitive differentiation content against Drift and traditional-search alternatives, audit and refresh the 31 dropped themes before they erode further, and expand content around the newly emerged high-intent themes (Case Studies, Industry & Market Fit, Salesforce & Enable) to capture the buyer-intent signal while it's fresh.
Related Documentation
- Q&A Analysis: Generate the two reports this comparison diffs, and see where its Query Frequency Histogram and Citation Phrase Suggestions come from
- Citation Monitor: Confirm whether growing competitive intent is translating into competitors actually being cited instead of you
- AI Visibility Suite Overview: How Trend Comparison fits alongside the rest of the AI Visibility Suite